Help: Data Service
Concepts
Resources/dataset/entity/attribute concept
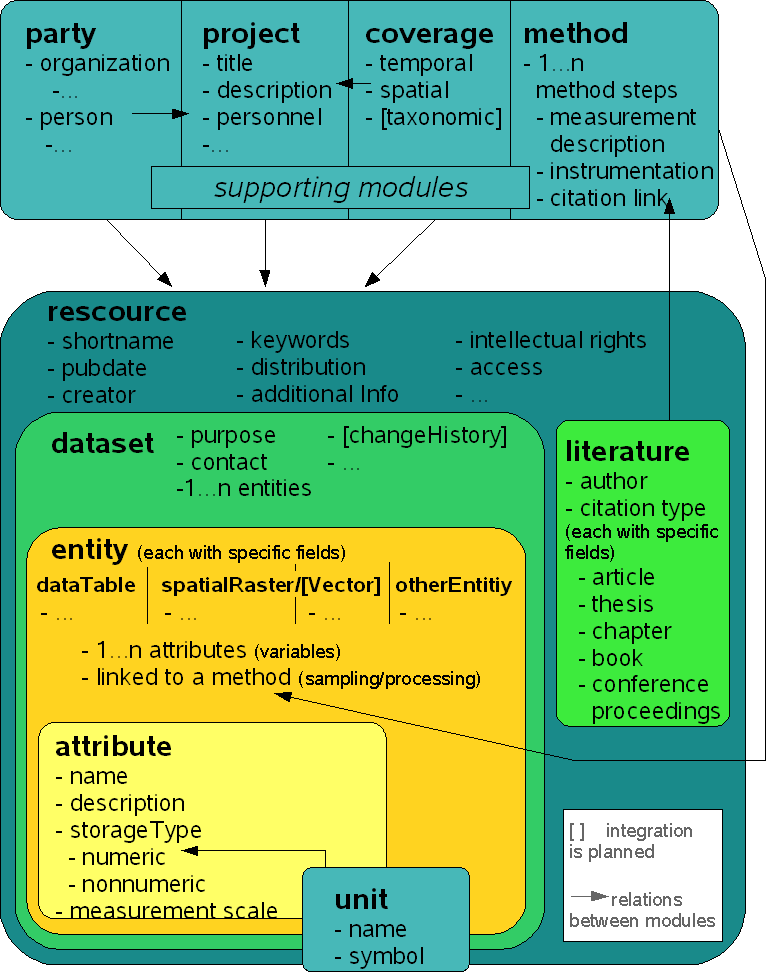
Schema of EML modules integrated in the FOR816dw (simplified)
EML modules used in the FOR816dw
The implementation of the EML framework into the relational structure of the FOR816dw considers the main modules of the specification. All metadata are based on the resource module, which holds the basic information. A resource can be a dataset or literature. The supporting modules help to give detailed description on those top-level resources.
A dataset contains one or more entities which might hold tabular data, raster data or data in an other format. Each entity is described by specific fields but all values of each entity are related to an attribute. The attributes are defined once and can be reused by other datasets. This makes values of different creators (possibly measured by different methods) comparable within the Data Warehouse.
All metadata are included into the extended data search and can be specified by the user to find datasets or literature of interest.
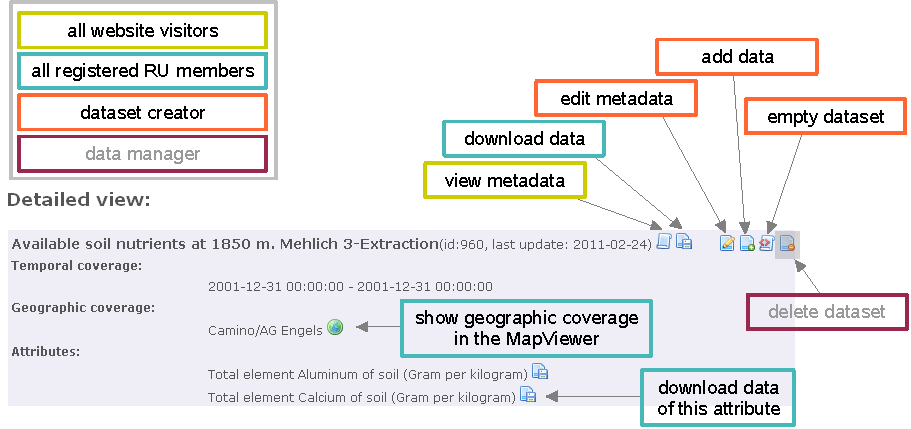
Previlages concept
The figure below describes the concept of access and editing previliges for the datasets.
Temporal and Geographic coverage concept
further content will follow...
Temporal coverage -> Timespan
Geographic coverage -> Bounding box
Usage, Property rights, Citation
The usage of all data undely the overall "Data User Agreement", which has been read and accepted by each registered member at his/her first login.
The main points are:
- data are visible and downloadable for all registered members
- data are not given to thirds
- when using foreign data in the own work , inform the data owner
- when publishing data, property rights have to be maintained
- in case of publication, the data owner might be included in the list of authors
The property rights always remain with the data creator(s). This is the person, or a group of person (in priority order) that has been entered by the uploader as the dataset owner(s) in the metadata.
A citation of a dataset or better a reference to a dataset (DS) as an online resource is:
“DS-Creator/s (Publication year YYYY): DS-Title. Online available (www.tropicalmountainforest.org/data_pre.do?citid=DS-ID) from DFG-FOR816dw. [Date of download: YYYY-MM-DD]”.
Like every reference to an internet resource via URL, you should give the “Date of access” or “Date of download”.
In this way it is easy to trace back whether the dataset had received a new timestamp (“Last updated”) in the meantime as a result of a change, correction or update.
Example: Peters T. and Richter M. (2011): Climate Station Data Pasto Abraham. Available online (www.tropicalmountainforest.org/data_pre.do?citid=970) from DFG-FOR816dw. [Date of download: 2011-07-23].
Additionally it is possible to publish a dataset via the FOR816dw and mint a DOI for this dataset. Those datasets will be citable in a more public and persistently way.
- back to top -
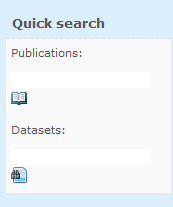
Search
In the FOR816 there are two search possibilities. You can search for datasets or publications.
In general, the fastest and fairly self-explanatory search method is to use the quick search located in the left side bar. Type in any desired search phrase and press "Enter" to find data or publications in the FOR816 data stock. To search in the FOR816dw you can also use the search bar on top of the data set list . In order to recieve satisfying results it is advisable to try variations of your search phrase (e.g. suitable synonyms) since the data set creators might have used different terminology to describe their data sets or publications.
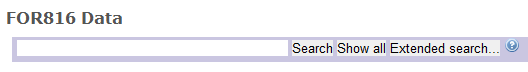
Datasets
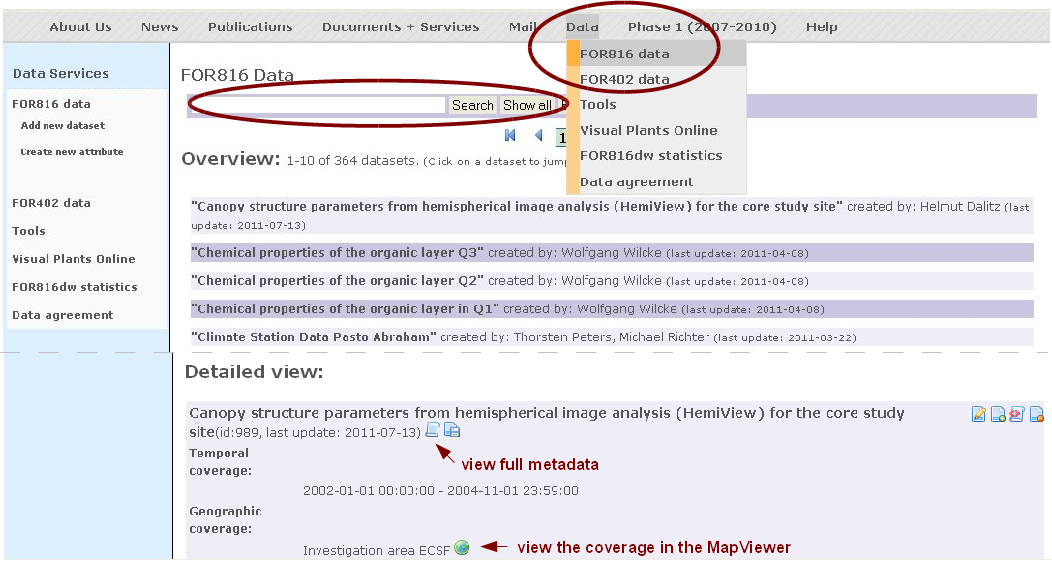
To search for datasets of the research unit you have to use the search field in Data -> FOR816data. Initially the search result below contains all avalibale datasets ordered by creation date (newest first). A pagination is activated, so that allways 10 results are shown on one page. You can scroll throug the pages with the arrows on the top.
The search result is bulid up of two views on each page. The Overview with the dataset name, creator name and creation/update date on the top of the page. The same datasets are shown below in a more Detailed View. This contains information on the temporal and geographic coverage of the datasets as well as of the accociated attributes/variables that are included in the dataset. In the detailed view you find the buttons for vieweing the full metadata (here you find all information stored for this dataset), to dwnload and maintain the datasets (see the previlages concept for more information).
To serach for datasets you can enter a search phrase into the search field. To reset the result use the "Show all" button. Multiple search terms in the search phrase are combined by an logical OR. Only full words are found ("soil" will find "soil" but not "soils"; "soils" will only find "soils"). The search is not key sesitive (Soil=soil=sOil). The search considers the following metadata fields:
- Dataset name (Title)
- Dataset ID
- Creator name (given name and surname)
- Assiciated party (given name and surname)
- Attribute name and attribute lable
- Geographic coverage description
- Keywords
In some cases it might be interesting to search in the previous database of the FOR402. Most tabular data are migrated to the FOR816 but especially raster data (aerial and satellite images) are not yet migrated to FOR816. You find access to the old database only via the external link in Data -> FOR402data.
Extended Dataset Search
Taking the increasing amount of available data into account there are various conceivable scenarios in which you might find it helpful to rely on more extensive search functionality than a text phrase. Thus, surpassing the basic search, the extended search provides the possibility to comfortably and purposefully find data sets or simply browse through the database by applying comprehensive filter criteria.
To enhance your search experience you may - according to requirement - combine spatial and technical as well as administrative parameters.
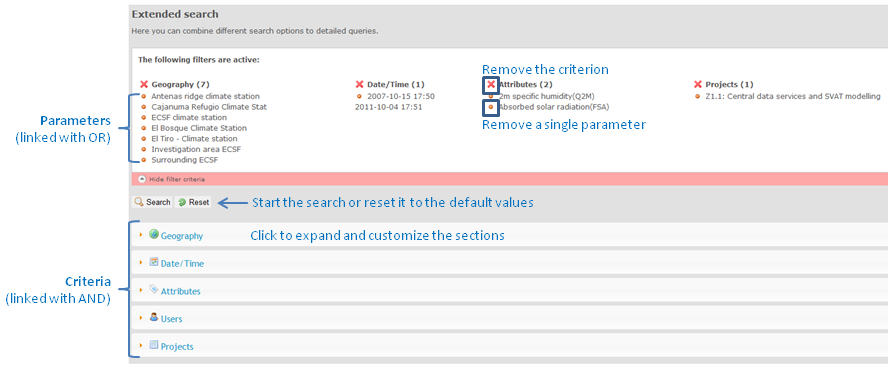
Your active search parameters are shown in the criteria bar on top, where it is also possible to remove single parameters and entire criteria.
Please note that the specified parameters of one criteria are logically linked with OR and the different criteria are logically linked with AND within the search algorithm.
Example: Find data sets which match the criterion "Geography" (Parameters: GeoCoverage1 OR GeoCoverage2) AND the criterion "Attributes" (Parameters: Attr.1 OR Attr.2 OR Attr.3) AND the criterion "Users" (Parameter: User1).
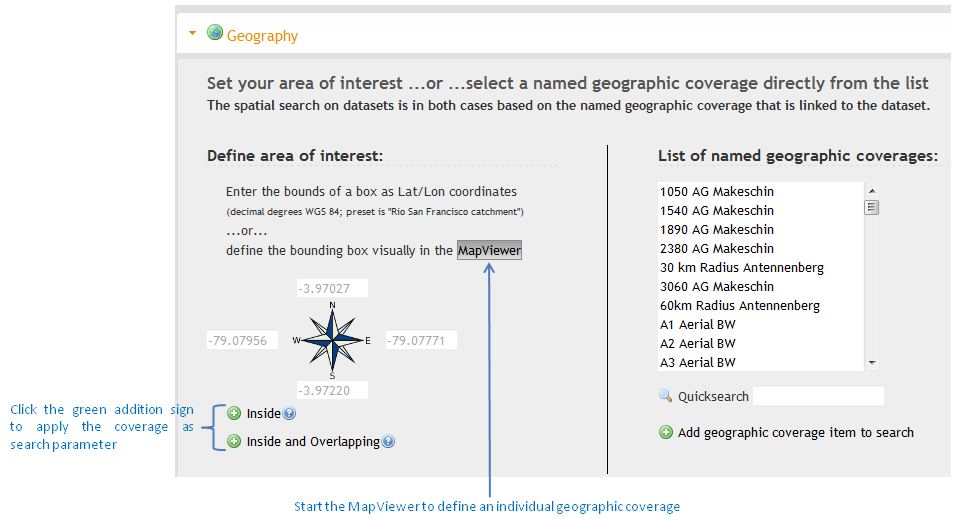
- Geography: Expand and adapt this criterion if you want to discover, which data are available at specific reference points or within rectangular areas. The already defined geographic coverages are dissplayed in the list of pre-defined coverages on the right hand side from which you can add sutibale coverages to your search.
Alternatively, typing coordinates into the corresponding fields or using the MapViewer tool allows you to comfortably define an inidividual spatial rectangular area or point as search parameter (see the help section MapViewer to read further information about how to use).
Once you have defined your point or area of intereset in the MapViewer you need to submit the selection and in the case of a rectangular selection decide whether only data inside or also overlapping data shall be considered (Hover the blue question mark symbols to get further help for making your decision).
- Date/Time: In some cases you might want to limit the search results to a defined time span. Hence, specify a date or time range as parameter to recieve corresponding data sets. If you don't adapt this section all data will be considered.
- Attributes: Refine the search by using particular user defined attributes as parameters. The way to find and select attributes is to use the category tree (click the button "Get attributes from category tree..."), where the attributes are topically and hierarchically sorted by discipline specific and descriptive categories. Check the control boxes to select single attributes or entire categories and press "submit selected attributes" to submit your selection to the extended search as parameters.
- Users/Projects: Use this option to find data published by specific users and projects respectively.
Hints:
Use the quick search field where available in order to rapidly find existing entries.
Hover the blue question marks to get instant help.
Search publications (not completet yet)
Use the search field in Publictaions.
The search considers the following metadata fields:
Upload and maintenance
Upload tabular data
Requirements for data upload
If you want to upload tabular data to the FOR816 data warehouse (FOR816dw), you need
- an ASCII csv file containing your data values and
- meta information on where and how the data has been collected and who did that.
If you insert data values and meta information to FOR816dw, this data forms a so called dataset in the database system. This dataset can be extended in a following edit session. Prior to the data upload you therefore have to decide if you want to
-
create a completly new dataset
-
add a new entity (table, raster or other) to an existing dataset
-
append values to an already existing tabular entity.
- back to submenu -
Structure of the CSV file
CSV stands for comma separated value meaning that a csv file contains values separated by a comma (“,”). A csv file therefore is nothing more than a table format (like you might now from Microsoft Excel) except that the column boundaries are not graphically indicated (e. g. vertical lines) but represented by a comma. Consequently the data values must have a point (“.”) as decimal sign and must not have a comma as the thousand delimiter. If you use text in a csv file, it has to be enclosed in quotes (“your text”).
When the csv file is uploaded to the FOR816dw it is processed operationally and therefore it has to full fill some general conventions:
- The first line of the csv file must contain the names of the columns (separated by commas).
- The n following lines must contain the corresponding values (separated by commas).
As for the column headers, only predefined names (attributes) are valid. The defined attributes are listed and categorized in the "Attribute Category Tree". If none of these attributes match your data please contact the s to complete the list. Please note, that associated to each attribute specific units of measurement are defined. Therefore, the data values must match these units (e. g. air temperature at 2 m height is given in Grad Celsius).
If you use table calculation programs like Excel or database programs like Access to store your measurements you can easily export these data to a csv file using simply the “save as...” function or the built-in export function. Using the german language settings you may have to change the separation symbol from semicolon (“;”) to comma manually within a text editor.
Since June 2010 the date and time information of each data record/ measurement are not anymore categorically requested as one attribute/ column of the dataset but it is still strongly recommended (see section "Date and time information in the CSV file"). Equally, you may add to each attribute a joint attribute for the quality of the data values according to your expert knowledge (see section "Quality Information of the data records").

- back to submenu -
Date and time information in the CSV file
Information about date and time of the data collection is essential for the quality of longterm data archiving. It is given with the meta information for each CSV file and supplied directly with the data values as an attribute. Therefore, each line of the CSV file should have a date information. The time information can be neglected if appropriate. If your record has absolutely no time dependence, the date can be set to "null".
For the date and time information, the following formats can be used:
- YYYY-MM-DD
- YYYY-MM-DD hh:mm
- YYYY-MM-DD hh:mm:ss
with “YYYY” the four digit year, “MM” the two digit month, “DD” the two digit day, “hh” the two digit hour, “mm” the two digit minute and “ss” the two digit second. All other date/time formats will be rejected. Within Microsoft Excel you have to define your own data format (“benutzerdefiniertes Zellenformat”) to generate this output. The name of this column is “datetime”.
- back to submenu -
Quality information of the data records
In respect to the longterm archiving of all data in the FOR816dw, information on the quality of the data will be stored. You are strongly recommended to generate yourself a column adjacent to each attribute according to your expert knowledge. This column must be named equally than the attribute itself and followed by “_quality”, e.g. if the name of the attribute “Air temperature in 2m” is “Ta_2m” then a column called “Ta_2m_quality” may be created. According to your own necessities the quality could be set in the range of 0 (very bad quality) to 100 (very good quality) for each value. A non-numeric quality flag (like 'a', 'b', etc.) is also possible but has to be explained in the meta information of this attribute. Furthermore, the quality information can be neglected or explicitly set to “null” (write “null”!) if no information about the quality of the data record can be given.
- back to submenu -
Example of a CSV file
- Measurement of parameters at one site.
The following shows you an example of a csv file containing 2 m air temperature and surface precipitation measurements for four hours in 2003 at one site:
datetime, PCP, PCP_quality, Ta_2m, Ta_2m_quality
2003-04-11 11:00:00.0, 5.4, null, 273.4, 80
2003-04-11 12:00:00.0, 5.3, null, 278.3, 80
2003-04-11 13:00:00.0, 5.3, null, 278.3, 80
2003-04-11 14:00:00.0, 5.3, null, 278.3, 80
As you can see, the first line defines the column headers. The first column gives the date and time (“datetime”), the second one defines the first measurement parameter (precipitation, “PCP”), the third one gives the quality of the precipitation values (“PCP_quality”), the forth one gives the second measurement parameter (air temperature 2 m above the surface, “Ta_2m”) and the last one gives the quality of the temperature values (“Ta_2m_quality”). Of course more attributes can be added.The second to fifth line contains the data values with one line for each time step. As for the first line, the different column values are separated by commas. Of course more lines can be added.
- Species x sample collections from different site.
This upload possibility is an accommodation for (ecological) data which is already formatted as a table for different objects (e.g. species) at many different sites measuring always the same parameter (e.g. abundance). Additionally, different site information including exact geographic coordinates (see section below) can be given in the header of this table. Instead of many datasets at each site only one dataset will be generated out of these tables. Therefore the most important requirement of this upload possibility is, that meta information is identical for all sites. For detailed instructions on this possibility see this “HowTo” (pdf, de).
Geographic coordinates
Geographic coordinates of your sample area are given with the meta information of each dataset. Furthermore, subplot georeferencing is supported by geographic coordinates as an attribute for each record (for each single measurement, species or any kind of object). Please use the following column names to store this kind of information. Use the bounding coordinates in decimal degrees ( WGS 84, geographic coordinates).
• geocoordinate_latitude_min: Latitude in decimal degrees with up until five decimal numbers
• geocoordinate_latitude_max: Latitude in decimal degrees with up until five decimal numbers
• geocoordinate_longitude_min: Longitude in decimal degrees with up until five decimal numbers
• geocoordinate_longitude_max: Longitude in decimal degrees with up until five decimal numbers
• geocoordinate_amsl: meters above mean sea levelIf you just want to specify a point instead of an area, please enter the same values for the min / max columns.
Example: ECSF-Station (as an rectangle)
geocoordinate_latitude_min: southern boundary (-3.97254 )
geocoordinate_latitude_max: northern boundary (-3.97238 )
geocoordinate_longitude_min: westerly boundary (-79.07630)
geocoordinate_longitude_max: easterly boundary (-79.07600)
- back to submenu -
Meta information
Scientific data is stored as so called datasets in the FOR816dw that is a bundle of data and its describing metadata. There are two “sorts” of meta information:
- Meta information about the principal purpose of the data, the geographic location and the group of persons that has been involved in the data collection and processing.
- Meta information on the exact measurement and processing method (including instruments) of each data attribute that is part of the dataset.
A structured overwiew of all metadata fields is given in the charts in section A + B. The available fields to describe your data are underlined, optional fields are signed with brackets [ ].
The first kind of meta information is more general, time invariant and has to be supplied only once per dataset. The moment when this information is saved a new dataset with new running ID has been created. The second kind however has to be supplied for every data attribute of the dataset and might change over time if the measurement and processing method of a data attribute changes (e. g. one PT100 thermometer is replaced by a PT1000 thermometer at station xy). This implies that even if you add data to an already existing dataset you will be asked if the measurement method has been changed and – if this is the case – you have to supply this new information.
A: All meta information is supplied to the FOR816dw interactively through the user interface. The meta information for each dataset encompasses the following (see also chart below):
- Title: long title of the dataset
- Short name: of the title for displaying reasons
- Keywords: selected from a list or generate new ones
- Purpose: optional text with a short description of the dataset
- Publication place: is pre set to “FOR816Datawarehouse” and can be changed if appropriate
- Publication date: is pre set to the current date and can be changed if appropriate
- Geographic coverage: the Plot or area where the dataset was taken selected from a list or create a new one (than you need the name, the bounding coordinates in decimal degrees (WGS 84, geographic coordinates) and the altitude bounds in m asl)
- Temporal coverage: is automatically read from the data values. Change the time zone! All times are in UTC (or GMT), Ecuador is -5, Germany is +1 or appropriate
- Project: the subproject within the data was sampled, pre set to the project of the logged in person, change if appropriate
- Resource creators: the persons who sampled the data, the logged in person is already shown, add other persons from list if appropriateAssociated party:optional add persons from list which helped with the sampling but are no creators
- Corresponding Contact: the persons who is the corresponding contact of the data, the logged in person is already shown, add other persons from list if appropriate
- Abstract: optional text which gives a summery of the dataset
- Additional info: optional text which gives any other information to the dataset
- Intellectual rights: pre set to “FOR816 data user agreement”, change or add if appropriate
- Language of the dataset: pre set to “Numeric values”, change if the dataset is non-numeric

Meta information concernig the whole dataset
B: The input wizard for the second “sort” of meta information for each data attribute encompasses the following steps (see also chart below):
- Procedure step: Select an existing procedure step that fits to the values of your attribute or create a new one.
Create a new procedure steop
- Title: Give a short descriptive title.
- Description: Free text descrbing the procedure of data sampling and processing (here you can refere to publications or link to a specified instrumentation description).
- Select citation: Select a publication already published in the FOR816dw or create a new citation.
- Select instrument: Form a list with already implemented instruments or create a new one.
Create a new instrument
- Instrument name: Name of the instrument (e. g. thermometer).
- Vendor: Building Company.
- Type: Specification of the instrumentation.
- Description: Short text describing the instrument.
- Measurement type: Select from list or add a new measurement type.
- Unit: Select from list.
- Resolution: Optional the resolution of instrument.
- Error: Optional the error range of the instrument.
- Dimension: Optinal the dimension of the instrument (1 if measured at point, 2 on an area, 3 in a volume).
- Size: Optinal the size of the measuring device (if dimension is 2 or 3) with units (e. g. 200 cm2).
- Additional parameter: Add measurements if the instrument meadures more than one parameter with all information as above (I to X).
- Meta information: The meta information is optimized for automated climatic measurment instrumentation, but can be used to describe any measurement instrumentation.
- Set measurement height for all selected measurments.

Attribute specific meta information
- back to submenu -
Data maintenance of uploaded data
If the logged on user is allowed to manage the data of a dataset the symbol for editing the dataset  is visible. Only the creator or the PI of the corresponding subproject is allowed to make changes on a dataset.
Two options exists to edit uploaded datasets in the FOR816dw (1. values, 2. meta data):
-
Update or correct the values of an already existing dataset you have created before
It gives the possibility to add new data to a time series dataset or to edit data values that are incorrect. This option is only applicable if the meta information related to the overall dataset (see section 7 above) has not been changed (i. e. the geographic location, the persons involved in measuring and processing the data values etc. have not changed).
The logic of the procedure to edit values is:
- Download the dataset
 . You receive the CSV file containing the values actually stored in the database.
- Correct or add values in the downloaded CSV file on your local PC. It is recommended to use a smiple text editor, so the format will not be changed.
(It is possible to add rows (new records) but also columns (new attributes). It is not allowed to delete columns. Minimum all attributes you have downloaded have to be included in the upload file.)
- Delete all values of this dataset using the "Empty dataset" function
") . The values will be deleted but the meta data will persist. (A backup of the values is stored on the server).
. The values will be deleted but the meta data will persist. (A backup of the values is stored on the server).
- Use the "Add values" function
 to upload the CSV file with the updated values to this dataset. This data will be stored in the database and useable for other users. If a new attribute has been added, the method of smpling and processing has to be described. You will automatically be asked by the wizzard.
- To delete an attribute from your dataset use the "Delete attribute" function
 . All values and the corresponding meta information will be deleted and are not restorable.
- The "last update date" of the dataset is automatically set to the current day. If you want to add other overall meta information to the dataset follow the description below.
-
Edit meta information of a dataset and its attributes
The creator of a dataset is allowed to complete or change the meta data entries of a dataset. This should only be done if you find mistakes or have updated values of the dataset. It is possible to change information or to add information (like an additional method step).
To edit the overall meta data use the "Edit meta data" function  .
.
To edit the description of the sampling and processing procedure of an attribute use the "Edit method descripton" funktion  .
.
-
deleting of a whole dataset is not desirable and can only be done by the central data manager. Once a dataset is created it has a unique ID and URL in the FOR816dw and it should be permanently locatable by other members. The deleting is only be done in exceptional circumstances and has to be justified by the dataset creator.
- back to submenu -
Use cases
-
Use case for creating a new dataset
- Login to the FOR816dw at www.tropicalmountainforest.org
- Go to the FOR816 data screen (Data > FOR816 data)
- Follow the link “Add new dataset” on the right side of the screen
- Follow the instructions on the web site
- Compare charts in section "Meta information" for the submission of meta information
- Use case for adding data to an already existing dataset
- Login to the FOR816dw at www.tropicalmountainforest.org
- Go to the FOR816 data screen (Data > FOR816 data)
- Go to the dataset (scroll down / search) you want to add data to
- Follow the link “Edit dataset” in the title line of the dataset
- Follow the instructions described in the section "Data maintenance of uploaded data"
-
Use case for editing meta information to an already existing dataset
- Login to the FOR816dw at www.tropicalmountainforest.org
- Go to the FOR816 data screen (Data > FOR816 data)
- Go to the dataset (scroll down / search) you want to edit data
- Follow the link “Edit dataset” in the title line of the dataset
- Select the kind of information you want to change.
- For editing overall meta data use the "Edit meta data" funktion
- For attribute specific descriptions use the "Edit method descripton" funktion
- Follow the instructions on the web site
- Compare charts in section "Meta information" for the submission of meta information
- back to submenu -
Download
Content will follow.
- back to top -
Analysis
Content will follow.
- back to top -
Tools
MapViewer
The MapViewer is a tool to investigate the area of interests of this project. It is used in various applictaions on the website and is located in "Data > Tools > MapViewer". It is divided into three main sections:
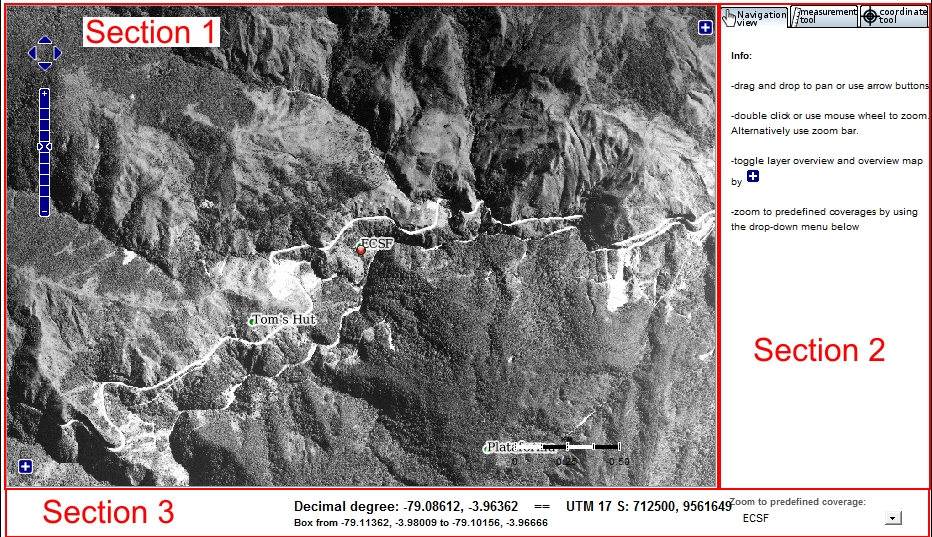
- Section 1 shows the current map extract.
- Section 2 holds three tabs. The first tab shows information, tab two offers different measurement tools and the last tab holds a coordinate tool.
- Section 3 shows additional information about your position and selected region. You can find a drop down menu on the lower right side to jump directly to a predefined map extract.
Section 1: You find a zoom-slider on the left along with movement arrows. You can also use the mouse with drag & drop to move the map extract and the mouse wheel to zoom. The "+" button in the upper right corner gives you the facility to choose different layers of the map, e. g. a colored image (satellite view). The "+" in the lower left corner offers a mini map to change the extract map quickly.
Section 2: You'll find 3 tabs here. The first one shows a quick help. The second one holds 3 tools:
- The first tool "measure distance" allow you to measure a distance from point A to B with several points between them. To use this tool you have to choose it and set the measured value. Now click on the map point by point. To end your selections simply double-click the last point. The calculated distance will show up in the corresponding information field.
- The second tool "measure area" allow you to measure an area defined with several points. To use this tool you have to choose it and set the measured value. Now click on the map point by point. To end your selections simply double-click the last point. The calculated area will show up in the corresponding information field.
- The third tool "elevation info" allow you to get the height information at a specific point. To use this tool you have to choose it and set the measured value. Now click on the map. The calculated height will show up in the corresponding information field.
The last tab holds the "coordinate tool". The compass shows 4 numbers, highlighted in blue and grey. The blue highlighted numbers are the degree coordinates and the grey highlighted numbers are the UTM coordinates. You can choose between point an rectangle mode (at the bottom). To go to a specific point or area just choose the corresponding mode and fill in the coordinates. The "east number" is the x coordinate of the upper left point of an area or a point. The "north number" is the corresponding y coordinate. Analogical the "east number" is the x coordinate of the lower right point of the area and the "south point" is the corresponding y coordinate. If you choose the point mode the "west" and "east" numbers as well as the "north" and "south" numbers are the same.
To get the coordinate of a specific point just choose the corresponding mode and click on the map. The compass will show the chosen coordinates.
To get the coordinates of a specific area just choose the corresponding mode. Click on the map to define the first point and click a second time to define a second point. The compass will show the chosen coordinates.
Section 3: This section shows your current position and choosen point or area coordinates (see section 2, "coordinate tool"). You can find a drop down menu on the lower right side to jump directly to a predefined map extract.
- back to top -
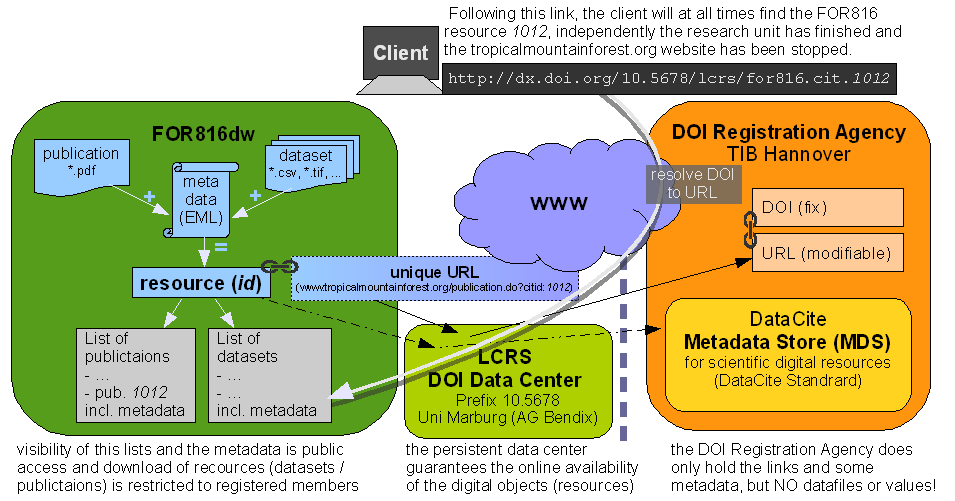
DOI Registration
DOI = Digital Object Identifier
Resolve a DOI name: http://dx.doi.org/
Further information on how to register your own dataset or publication with a DOI via the FOR816dw data center will follow end of 2011. If you are interested previously in this process, please contact the Data Manager.
The concept to link FOR816 resources to DOIs is shown in the figure below.
Some literature on publishing primary datasets with the DOI System:
Brase, Jan (2004): Using digital library techniques - Registration of scientific primary data. In In Lecture Notes in Computer Science, Volume 3652/2005, 488-494. doi:10.1007/978-3-540-30230-8_44.
Brase, Jan & Klump, Jens (2007): Zitierfähige Datensätze, Primärdaten-Management durch DOIs. Free PDF (german).
The TIB (Technische Informations Bibliothek Hannover) as the DOI registration agency:
"Registration of scientific primary data, to make these data citable as a unique piece of work and not only a part of a publication, has always been an important issue. In the context of the project ”Publication and Citation of Scientific Primary Data” funded by the German Research Foundation (DFG) the German National Library of Science and Technology (TIB) has become the first registration agency worldwide for scientific primary data. Registration has started for the field of earth science, but will be widened for other subjects in the future."
Schindler, U., J. Brase & M. Diepenbroek (2005):Webservices Infrastructure for the Registration of Scientific Primary Data. In Lecture Notes in Computer Science, Volume 3652/2005, 128-138, doi: 10.1007/11551362_12.
Chart source
The organistaion DataCite developed and maintains the DataCite Metadata Scheme for the Publication and Citation of Research Data.
- back to top -
